INDICATORS
| 11/2021 | 11/2022 | 11/2023 | 11/2024 | 11/2025 | |
|---|---|---|---|---|---|
| Basic earnings per share (¥) |
51.41 | 62.23 | 83.05 | 97.12 | 111.88 |
| Net assets per share (¥) |
1,240.70 | 1,371.63 | 1,445.12 | 1,495.67 | 1,556.22 |
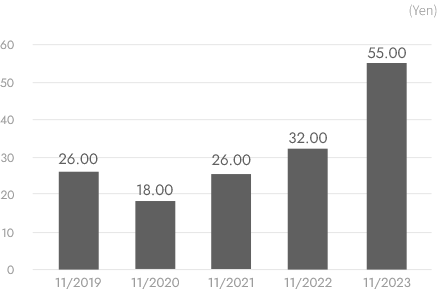
| Dividend per share (annual dividends) (¥) |
26.00 | 32.00 | 55.00 | 63.00 | 70.00 |
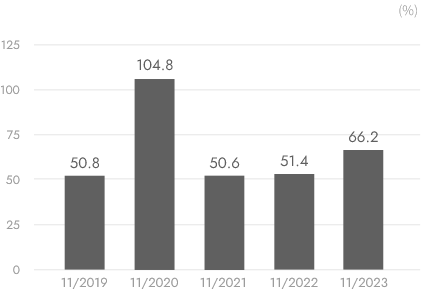
| Payout ratio (%) | 50.6 | 51.4 | 66.2 | 64.9 | 62.6 |
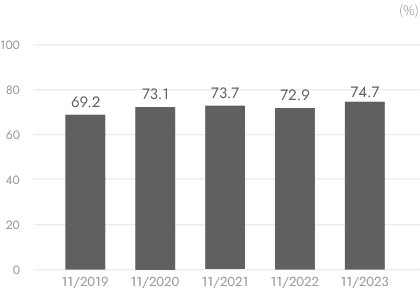
| Equity ratio (%) | 73.7 | 72.9 | 74.7 | 74.8 | 71.8 |
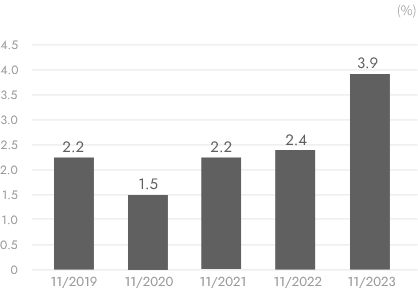
| Dividends on equity ratio (DOE)(%) |
2.2 | 2.4 | 3.9 | 4.3 | 4.6 |
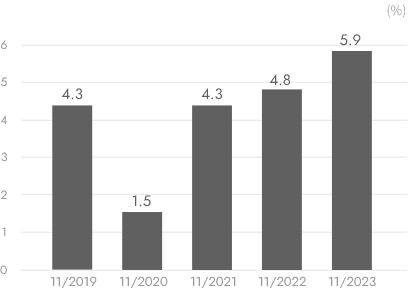
| Return on equity (ROE)(%) |
4.3 | 4.8 | 5.9 | 6.6 | 7.4 |
Key performance indicators for the last five years (32KB)Excel
Dividend per share
Payout ratio
Equity ratio
Dividend on equity ratio (DOE)
Return on equity (ROE)