PERFORMANCE HIGHLIGHTS
(Millions of yen)
| 2021/11 | 2022/11 | 2023/11 | 2024/11 | 2025/11 | |
|---|---|---|---|---|---|
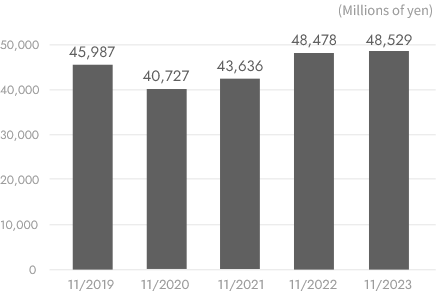
| Net sales | 43,636 | 48,478 | 48,529 | 48,537 | 56,867 |
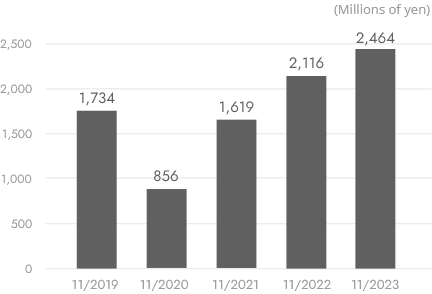
| Operating profit | 1,619 | 2,116 | 2,464 | 2,868 | 3,333 |
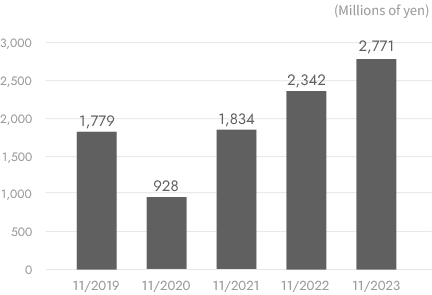
| Ordinary profit | 1,834 | 2,342 | 2,771 | 3,003 | 3,624 |
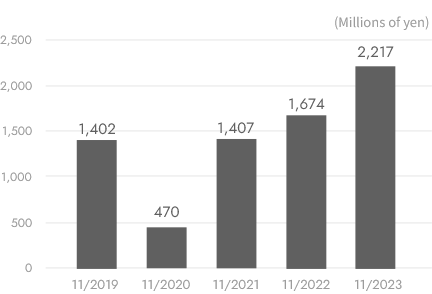
| Profit attributable to owners of parent | 1,407 | 1,674 | 2,217 | 2,572 | 2,916 |
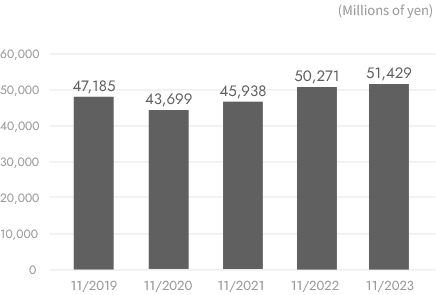
| Total assets | 45,938 | 50,271 | 51,429 | 52,476 | 55,498 |
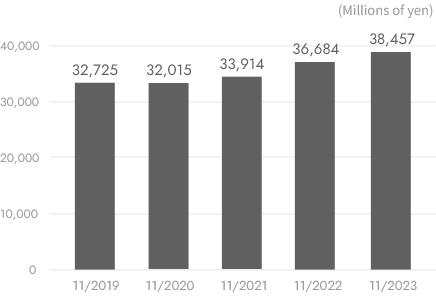
| Net Assets | 33,914 | 36,684 | 38,457 | 39,276 | 39,832 |
Highlights of business performance for the last five years(36KB)Excel
Net sales
Operating profit
Ordinary profit
Profit attributable to owners of parent
Total assets
Net Assets